


Interact with a chart
Charts enable you to visually represent a wide range of items in your project. You can interact with your chart to view the data behind the chart or explore a specific data point in more detail.
What do you want to do?
What can I explore in a chart?
Charts allow you to see your project from a new perspective. You may be able to make comparisons between project items or see patterns in your data.
You can switch between the Chart tab and the Summary tab—the Summary tab shows the data used to generate the chart.
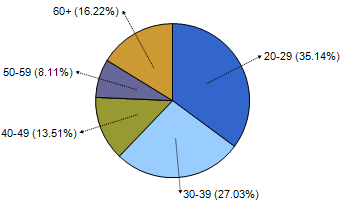
You can also drill down to explore a specific data point. In the example below, each wedge of the pie represents survey participants that belong to a specific age group . While viewing the chart, you might decide to explore the underlying data for a particular data point—for example the pie wedge that represents the 20-29 age group. You can drill down and find the nodes that belong to that group.
Depending on the data represented in the chart, you can also drill down in a chart to see content coded at a specific node or content coded at a node for a certain demographic.

Access the underlying data in a chart
To view the underlying data for the chart as a whole:
-
In Detail View, click the Summary tab. The data is displayed as a list that you can export—refer to Export project items (Export a list) for more information.
To view the underlying data for a specific data point:
-
Double-click on a data point—for example, bar or column—to see the underlying data. The resulting data will display in either List View or Detail View, depending on the data represented in the chart.