


About color
Color can help you to scan and locate items in coding stripes, charts and other visualizations. It can also help you to locate related items in List View. You can assign colors to sources, nodes, relationships, attribute values and project users.
In this topic
- Why assign item colors?
- What colors can I assign?
- Where can I see item colors?
- How do I set the color scheme?
Why assign item colors?
NVivo gives you the option of assigning item colors to sources, nodes, relationships, attribute values, and users. At different stages of your project you may decide to use color in different ways.
You can assign item colors to:
-
Visually distinguish nodes—or coding performed by specific users—in coding stripes.
-
Identify items assigned to different users—for example, sources that Mark needs to code are blue and sources that Sally needs to code are orange.
-
Keep track of significant nodes by giving them a color—for example, the node rising sea level could be assigned blue.
-
Add emphasis to particular sources or nodes—for example, nodes representing important or critical issues could be colored red.
-
Differentiate sources or nodes by attribute values in charts—for example, all males are displayed as blue and all females are displayed as pink.
-
Make it easier to see patterns or to compare charts created at different times.
-
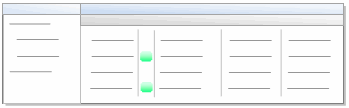
Indicate progress—for example, green for sources where coding is completed, as shown below:

What colors can I assign?
NVivo provides seven colors: blue, green, purple, orange, red, pink, and yellow.
You can assign these colors to:
-
Sources
-
Nodes
-
Relationships
-
Attribute values
-
Users
Where can I see item colors?
You can display item colors in the following:
-
Coding stripes
-
Visualizations (charts, tree maps and graphs)
-
Models
-
Sources List View
-
Nodes List View
-
Relationships List View
How do I set the color scheme?
You can set the color scheme that NVivo uses whenever you display coding stripes or create visualizations such as charts and graphs—you can set the default to either:
-
Display random system generated colors, or
-
Show the item colors you have assigned to nodes, sources, users, attribute values.
If you have displayed coding stripes in a source or node, or you are working in a particular chart or other visualization, you can override the default color scheme by setting the color scheme for the item you are working with.
Refer to Set colors for more information.